Mohammad Ridho Fahruni's Project
Coffee Sales Analysis
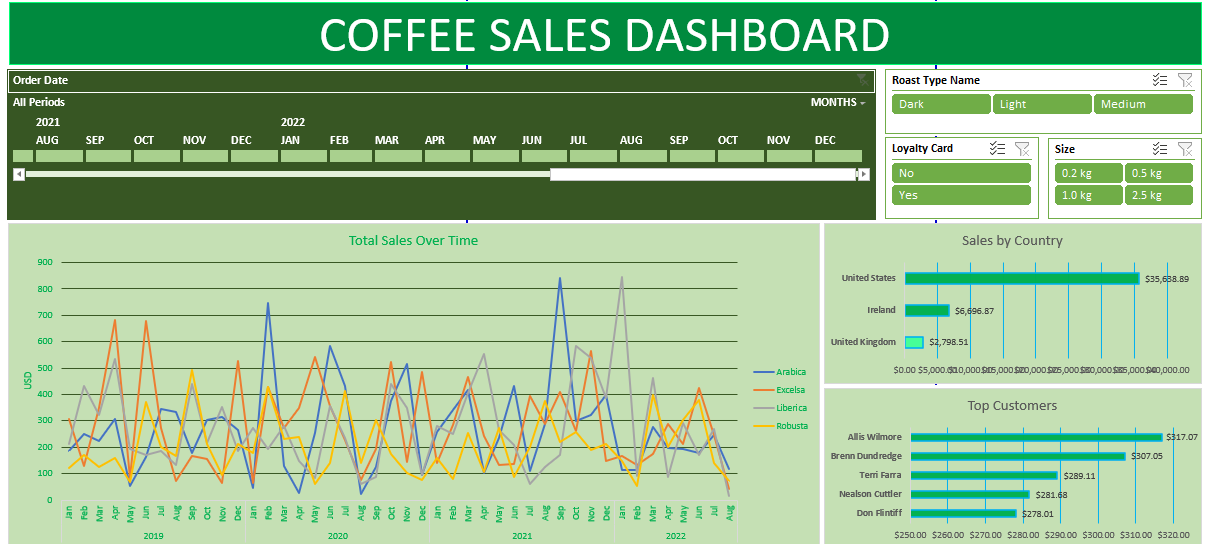
This analysis is mainly focused on analysing and finding pattern of a dataset of coffee sales around United States, United Kingdom, and Ireland from the year 2019 to 2022. The dataset includes detailed information about each order, such as the date, the types of coffee served, their sizes, quantities, prices, etc. This data was collected from here. By the end of this project, I hope to showcase my skills and proficiency in Excel or spreadsheet programs in general.
Preview of The Final Product of This Project
Project Structure
├── assets             <- Source for this project.
    │
    ├── Coffee Sales Analysis.xlsx           <- Finished project file.
    │
    ├── Dashboard Preview.png                <- Additional images for preview.
    │
    ├── coffeeOrders_RAW.xlsx                <- The raw data that has not been cleaned.
├── README.md          <- README for using this project.
Step-by-Step Analysis in Excel
- Data Familiarization:
- Conducted an initial review of the dataset to understand its structure and identify potential insights.
- Handling Missing Data:
- Identified missing data points and used
XLOOKUPandINDEX MATCHfunctions to retrieve and populate the required information accurately.
- Identified missing data points and used
- Populating Sales Column:
- Added a
Salescolumn using a simple multiplication formula to calculate total sales.
- Added a
- Expanding Abbreviations:
- Created new columns
Coffee Type NameandRoast Type Nameto replace abbreviations with full names. Used theIFfunction for this purpose:=IF(I2="Rob","Robusta",IF(I2="Exc","Excelsa",IF(I2="Ara","Arabica",IF(I2="Lib","Liberica",""))))=IF(J2="M","Medium",IF(J2="L","Light",IF(J2="D","Dark","")))
- Created new columns
- Data Formatting:
- Changed the date format to a more readable form.
- Updated the size format to include “kg”.
- Added currency symbols to the price and sales columns to enhance readability.
- Duplicate Check and Removal:
- Utilized the
Remove Duplicatesfeature to ensure data integrity. No duplicates were found.
- Utilized the
- Table Conversion:
- Converted the data range to an actual Excel table for better management and analysis.
- Pivot Table Creation:
- Generated pivot tables to summarize key metrics:
- Total Sales Over Time: Tracked sales trends over the specified period.
- Sales by Country: Analyzed sales distribution across different countries.
- Top Customers: Identified the top customers based on sales volume.
- Generated pivot tables to summarize key metrics:
- Adding Slicers:
- Enhanced pivot tables with slicers for interactive filtering:
- Roast Type Name
- Loyalty Card
- Size
- Enhanced pivot tables with slicers for interactive filtering:
- Timeline Addition:
- Incorporated a timeline for the
Order Dateto enable easy temporal analysis of sales data.
- Incorporated a timeline for the
- Dashboard Creation:
- Developed an interactive dashboard featuring:
- Pivot tables
- Slicers
- Timeline
- The dashboard allows for dynamic exploration and visualization of sales data insights.
- Developed an interactive dashboard featuring:
Conclusion
This analysis provides a comprehensive overview of the coffee sales data, highlighting key trends, customer behaviors, and geographical distribution of sales. The interactive dashboard facilitates easy exploration and presentation of the insights derived from the data. The project can easily be accessed by downloading the file here in which you can personally interact with the dashboard.